Finally, Google has launched an API for its new Google Analytics 4 properties. In this article I will explain to you what you can do with the new Google Analytics Data API (GA4) and how you can use Python to retrieve data.
Please check out my other article if you haven’t upgraded to the latest GA4 property yet.

Google Analytics Data API (GA4)
If you have worked with the Google Analytics APIs before, then you know that Google normally splits up the APIs according to their functionalities. As described in my other articles about the Google Analytics API, there is normally a management and a reporting API. If you want to know about the original APIs, please check this article if you write Python, or this one if you prefer Google App Script.
The new GA4 Api can only be used to retrieve data, and can therefore be compared to the previous Google Analytics reporting API. This API can be used to get data from more than 100 properties. Or, you might have a script that gets your data on a repeated basis and sends an email based on this data. Any data that you can retrieve using the User Interface, can be retrieved programmatically using the API. This gives you the opportunity to integrate your Google Analytics data with other business applications as well.
Google distinguishes different types API calls that you can execute to retrieve actual Google Analytics data. The first two are the most simple ones and include getting just 1 report (runReport), or multiple reports at the same type (batchRunReports)
Additionally, Google has introduced a more complex API call that allows you to pivot your data. These reports are defined as more advanced and expressive formats than regular reports. Again, there is one type of API call for just 1 report (runPivotReport), and another one for getting multiple reports at the same type (batchRunPivotReports)
- runPivotReport
- batchRunPivotReports
Then, similar to the previous Reporting API, you can also get Real-time data. These reports show data for the last 30 minutes on your website or app. Note that there is no batch version of this API call.
The last type of API call includes getting metadata, hence more information about the data you are retrieving (such as metadata for dimensions and metrics)
Please read the rest of the article to understand how to use the Google Analytics Data API (GA4) with Python.
Authenticating the Google Analytics Data API (GA4)
As with any API, you will need to “tell” the API that you are allowed to retrieve the data that you are requesting. This is why we have to authenticate first, and there are multiple ways of authentication yourself. Please check my previous Google Analytics Reporting API article, to see the different types of authentication. For the Google Analytics Data API (GA4) with Python, we will use the service account approach.
Enabling the Google Analytics Data API (GA4)
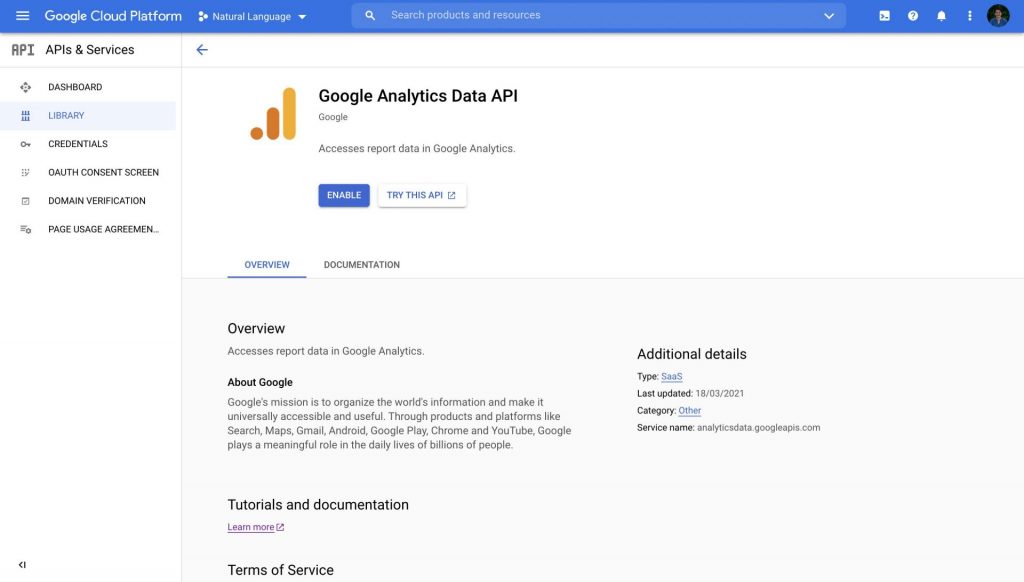
First we will start by enabling the Google Analytics Data API by navigating to your Google Cloud Platform Console. If you haven’t created a GCP project yet, please check Google’s documentation. No worries, all the resources you are going to use in this tutorial are completely free. Search for “Google Analytics Data API” and click on the top result. Now you can click on “Enable” so we can start making use of the Google Analytics 4 API.
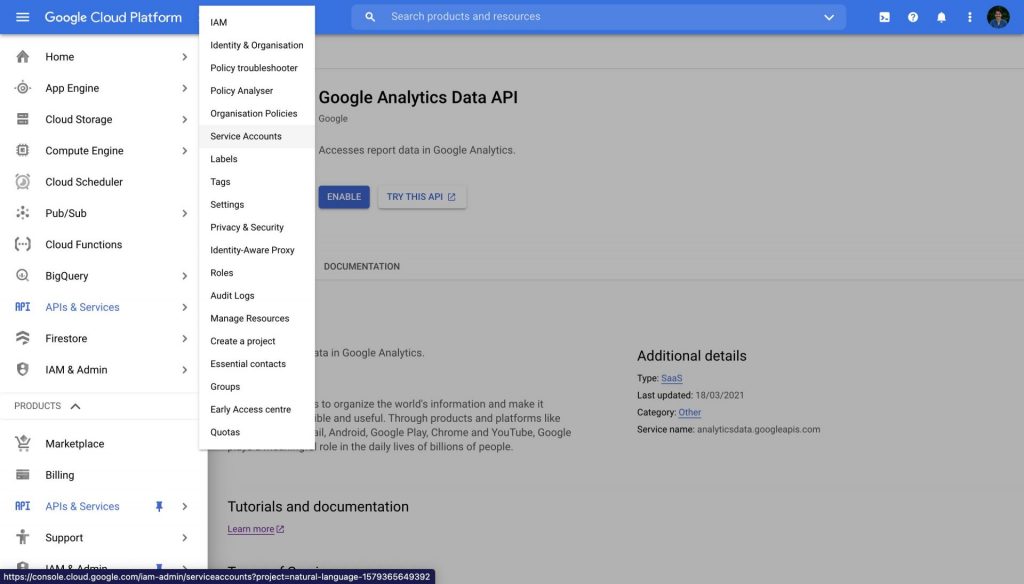
After you have enabled the API, click on the hamburger icon in the top left corner to see other resources. We are going to navigate to the service account settings by clicking on “IAM and Service“, and then on Service Accounts.
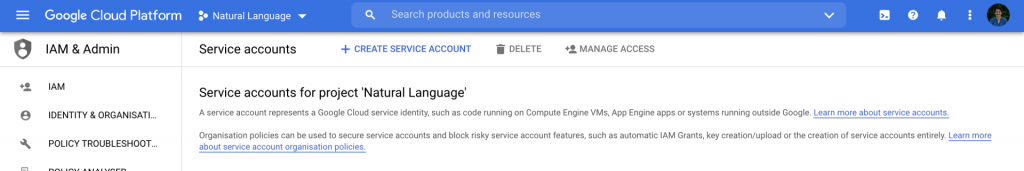
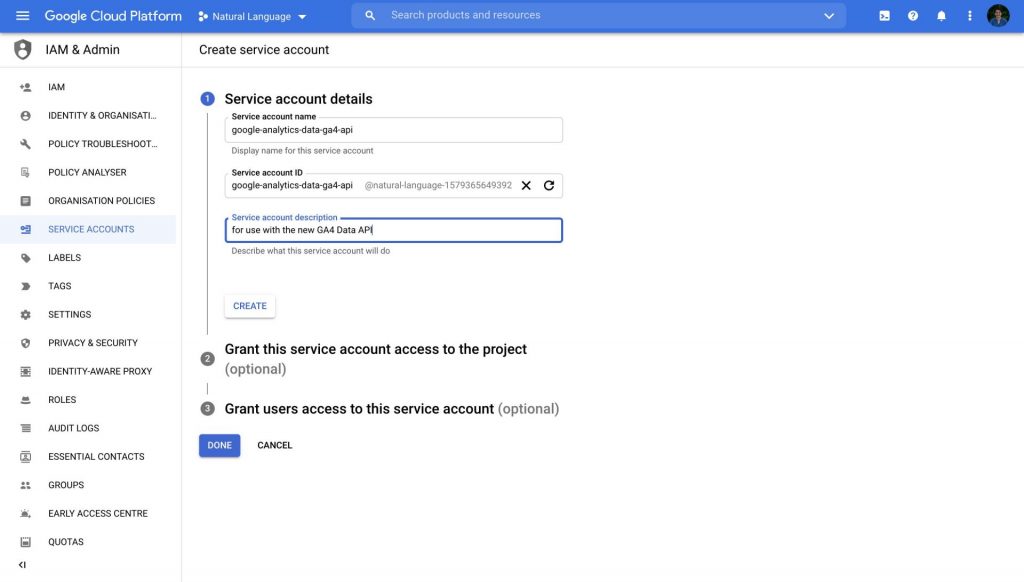
Now we should be in the service account settings and we can click on “+ CREATE SERVICE ACCOUNT” to start creating the necessary service account.
Fill in a name for this service account and then click on “Done”. The name doesn’t really matter, but for best practices, you do want to include a descriptive name and a description that explains how you are going to use this service account.
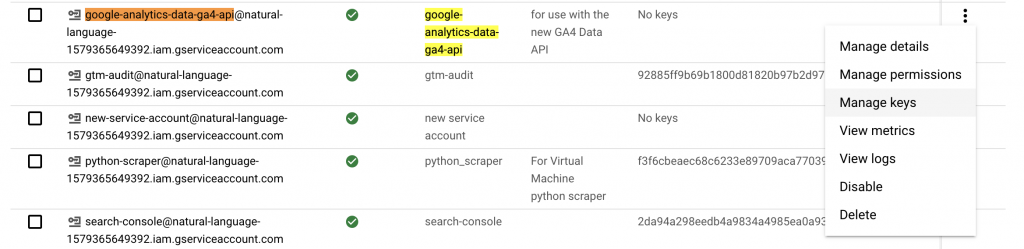
Now you have created your service account, and the only thing that is left to do is creating the service account key. This will be a JSON file that you can use in your script to authenticate the API. Therefore, you will need to click on the three dots all the way on the right of your service account, and then click on “manage keys”.
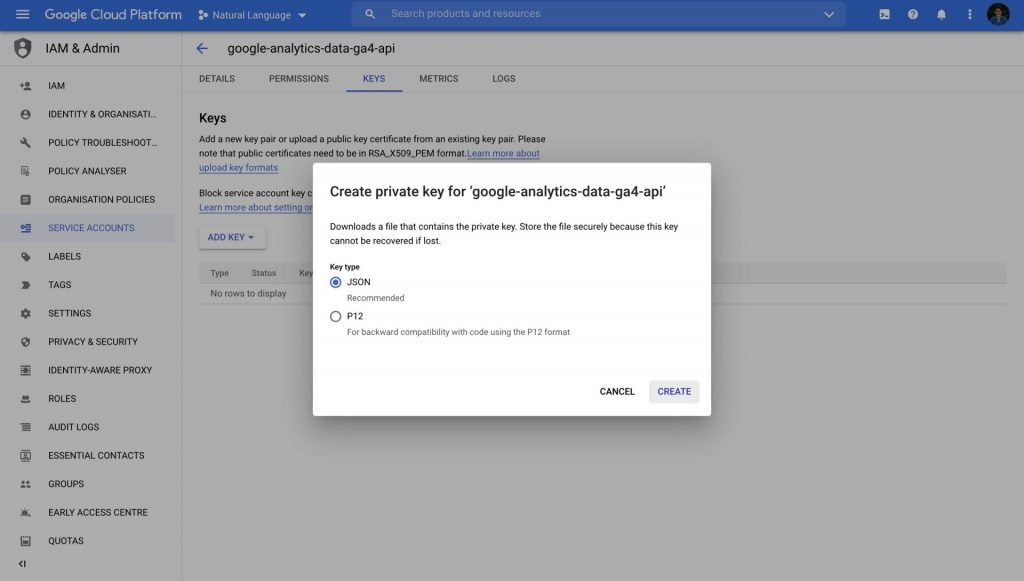
You will see that there are currently no keys associated with this service account, so click on “ADD Key”, and on “New Key”. For our approach, we are going to use the JSON file, so leave the settings the way they are and click on “CREATE”. This will automatically start a download of the JSON file.
Adding the Google Analytics Data API (GA4) service account to your GA4 property
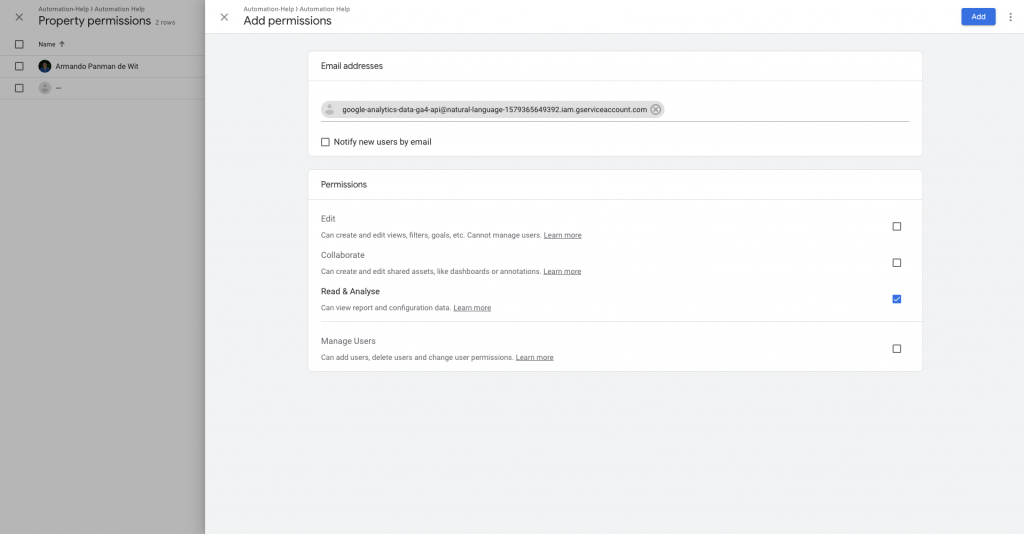
We are almost done with the preparations. The last step before we can start writing code includes going to your Google Analytics 4 property and adding your service account to its user management. You can find the email address of your service account by opening the JSON file with a text editor. There you will find the “client_email” which looks like service_account_name@project_name-project_id.iam.gserviceaccount.com. Alternatively, you can find the email address in your service account settings. Then you can go to your GA4 property in Google Analytics, and click on Admin Settings –> Property User Management. There you should see a big blue plus button in the top right corner. “Read & Analyse” permissions should be sufficient (see image below).
Run a simple report using the Google Analytics Data API (GA4)
We can finally start writing some code. Install the Google Analytics Data API (GA4) by using the following pip command in your terminal. If you don’t have Python installed yet, please check my article about installing Python with Anaconda.
pip install google-analytics-data
If you are running your scripts on your local machine, then please put the JSON file in the same folder as your Python file. With the code below we will set an environment variable called “GOOGLE_APPLICATION_CREDENTIALS” with the value of your JSON file. This is necessary for our script to know where the JSON file is located.
import os
# Set environment variables
os.environ['GOOGLE_APPLICATION_CREDENTIALS'] = service_account_file_path
Now we can run a simple report using the following code. Replace PROPERTY_ID, with the ID of your property. To find your property ID, navigate to the Google Analytics Admin setting and go Property Settings. You will find the property ID in the top right corner. Important, do not confuse the property ID with the measurement ID.
from google.analytics.data_v1beta import BetaAnalyticsDataClient
from google.analytics.data_v1beta.types import DateRange
from google.analytics.data_v1beta.types import Dimension
from google.analytics.data_v1beta.types import Metric
from google.analytics.data_v1beta.types import RunReportRequest


def sample_run_report(property_id):
    """Runs a simple report on a Google Analytics 4 property."""
    # Using a default constructor instructs the client to use the credentials
    # specified in GOOGLE_APPLICATION_CREDENTIALS environment variable.
    client = BetaAnalyticsDataClient()

    request = RunReportRequest(
        property=f"properties/{property_id}",
        dimensions=[Dimension(name="city")],
        metrics=[Metric(name="activeUsers")],
        date_ranges=[DateRange(start_date="2020-03-31", end_date="today")],
    )
    response = client.run_report(request)

    print("Report result:")
    for row in response.rows:
        print(row.dimension_values[0].value, row.metric_values[0].value)


sample_run_report(PROPERTY_ID)
The code above will print the cities and the active users for your property since “2020-03-31”.
Save the results in a CSV/Excel
The example I have shown above will print the results on your machine. However, most of the time you would want to export these reports in a CSV or Excel file. For this, we can use the Pandas library. If you want to save to a CSV you will use “.to_csv“, and for Excel you will use “.to_excel“. See an example of CSV below.
import pandas as pd

def sample_run_report(property_id, export_path):
    """Runs a simple report on a Google Analytics 4 property."""

    # Using a default constructor instructs the client to use the credentials
    # specified in GOOGLE_APPLICATION_CREDENTIALS environment variable.
    client = BetaAnalyticsDataClient()

    request = RunReportRequest(
        property=f"properties/{property_id}",
        dimensions=[Dimension(name="city")],
        metrics=[Metric(name="activeUsers")],
        date_ranges=[DateRange(start_date="2020-03-31", end_date="today")],
    )
    response = client.run_report(request)

    output = []
    print("Report result:")
    for row in response.rows:
      output.append({"City":row.dimension_values[0].value, "Active Users": row.metric_values[0].value})
    df = pd.DataFrame(output)
    df.to_csv(export_path)

sample_run_report(PROPERTY_ID, "export.csv")
df = pd.read_csv("export.csv")
df.head(5)
Batch report
The batch report allows you to retrieve multiple reports with only one API request. As you can see it looks really similar to our previous request, but in this case, you are putting multiple RunReportRequest objects inside aBatchRunReportsRequest object. You only have to define the property ID once inside thisBatchRunReportsRequest object.
Now you might wonder why would I use a batch request if I can do multiple “normal” requests. Well, whenever you are working with APIs you want to make a minimal number of API requests. This is because an API is just a server, and each time you are doing an API request, the server needs to respond. If multiple people are making use of the same API, this server can be overloaded and start to respond slowly. Therefore, we always try to “make life easier for the API” by minimizing the number of API requests to a server.
import pandas as pd
from google.analytics.data_v1beta import BetaAnalyticsDataClient
from google.analytics.data_v1beta.types import DateRange
from google.analytics.data_v1beta.types import Dimension
from google.analytics.data_v1beta.types import Metric
from google.analytics.data_v1beta.types import BatchRunReportsRequest
import os

os.environ['GOOGLE_APPLICATION_CREDENTIALS'] = service_account_file_path

def sample_run_report(property_id, export_path):
    """Runs a batch report on a Google Analytics 4 property."""
    # Using a default constructor instructs the client to use the credentials
    # specified in GOOGLE_APPLICATION_CREDENTIALS environment variable.
    client = BetaAnalyticsDataClient()

    requests = BatchRunReportsRequest(
        property=f"properties/{property_id}",
        requests = [
      RunReportRequest(
        dimensions=[Dimension(name="city")],
        metrics=[Metric(name="activeUsers")],
        date_ranges=[DateRange(start_date="2021-03-01", end_date="2021-04-01")]
    ), RunReportRequest(
        dimensions=[Dimension(name="city")],
        metrics=[Metric(name="activeUsers")],
        date_ranges=[DateRange(start_date="2021-04-01", end_date="2021-05-01")]
    )
    ])
    response = client.batch_run_reports(requests)

    output = []
    print("Report result:")
    for index, report in enumerate(response.reports):
      for row in report.rows:
        output.append({"report": index, "City":row.dimension_values[0].value, "Active Users": row.metric_values[0].value})
    df = pd.DataFrame(output)
    df.to_csv(export_path)

sample_run_report(PROPERTY_ID, "export.csv")

df = pd.read_csv("export.csv")
print(df)
Pivot report
The pivot report allows you more control over the data you are trying to retrieve. For example, if you are only interested in the top 3 browsers for each country, then you are able to add a limit to your “browser” dimension. With the normal report you are only able to add a limit to the end-result of your query. With the pivot you can add these limits and offsets inside the pivots object. In the example below you can see how I am only looking at 10 countries and only the top 3 browsers for each country. If I wanted to look at the 5th popular up til 10th popular browser, I would add an offset of 5 to the Pivot object.
from google.analytics.data_v1beta import BetaAnalyticsDataClient
from google.analytics.data_v1beta.types import DateRange
from google.analytics.data_v1beta.types import Dimension
from google.analytics.data_v1beta.types import Metric
from google.analytics.data_v1beta.types import RunPivotReportRequest
from google.analytics.data_v1beta.types import Pivot
from google.analytics.data_v1beta.types import OrderBy


def sample_run_report(property_id, export_path):
    """Runs a simple report on a Google Analytics 4 property."""
    # TODO(developer): Uncomment this variable and replace with your
    #  Google Analytics 4 property ID before running the sample.
    # property_id = "YOUR-GA4-PROPERTY-ID"

    # Using a default constructor instructs the client to use the credentials
    # specified in GOOGLE_APPLICATION_CREDENTIALS environment variable.
    client = BetaAnalyticsDataClient()

    request = RunPivotReportRequest(
        property=f"properties/{property_id}",
        dimensions=[Dimension(name="country"),
                    Dimension(name="browser")],
        metrics=[Metric(name="sessions")],
        date_ranges=[DateRange(start_date="2020-03-31", end_date="today")],
        pivots=[
            Pivot(
                field_names=["country"],
                limit=10,
                order_bys=[
                    OrderBy(
                        dimension=OrderBy.DimensionOrderBy(dimension_name="country")
                    )
                ],
            ),
            Pivot(
                field_names=["browser"],
                offset=0,
                limit=3,
                order_bys=[
                    OrderBy(
                        metric=OrderBy.MetricOrderBy(metric_name="sessions"), desc=True
                    )
                ],
            ),
        ],
    )
    response = client.run_pivot_report(request)

    output = []
    print("Report result:")
    print(output)
    for row in response.rows:
      result = {}
      for index, dimension_value in enumerate(row.dimension_values):
        if index == 0:
          result["Country"] = dimension_value.value
        elif index == 1:
          result["Browser"] = dimension_value.value
      for index, metric_value in enumerate(row.metric_values):
          if index == 0:
            result["Sessions"] = metric_value.value
      output.append(result)

    df = pd.DataFrame(output)
    df.to_csv(export_path)


sample_run_report(PROPERTY_ID, "export.csv")
df = pd.read_csv("export.csv")
Real-time report
The real-time report has different dimensions and metrics you are allowed to use. Please check Google’s documentation to find the valid dimensions and metrics. In the code below you can find an example for getting the current active users grouped by cities.
import pandas as pd
from google.analytics.data_v1beta import BetaAnalyticsDataClient
from google.analytics.data_v1beta.types import DateRange
from google.analytics.data_v1beta.types import Dimension
from google.analytics.data_v1beta.types import Metric
from google.analytics.data_v1beta.types import RunRealtimeReportRequest
import os

os.environ['GOOGLE_APPLICATION_CREDENTIALS'] = service_account_file_path


def sample_run_report(property_id, export_path):
    """Runs a simple report on a Google Analytics 4 property."""

    # Using a default constructor instructs the client to use the credentials
    # specified in GOOGLE_APPLICATION_CREDENTIALS environment variable.
    client = BetaAnalyticsDataClient()

    request = RunRealtimeReportRequest(
        property=f"properties/{property_id}",
        dimensions=[Dimension(name="city")],
        metrics=[Metric(name="activeUsers")]
    )
    response = client.run_realtime_report(request)

    output = []
    print("Report result:")
    for row in response.rows:
      output.append({"City":row.dimension_values[0].value, "Active Users": row.metric_values[0].value})
    df = pd.DataFrame(output)
    df.to_csv(export_path)

sample_run_report(PROPERTY_ID, "export.csv")

df = pd.read_csv("export.csv")
print(df)
Get Metadata
Then lastly, if you are ever going to work with the API and you want to know which dimensions/metrics you can use. You can check the API Dimension/Metrics page for the regular dimensions/metrics. However, each property might have custom dimensions and reports. Therefore, you can use the metadata API. In the example below I am showing you how this API works, and how you can save the response in a CSV. You can imagine, that you might use this API call to find the API name for a custom dimension or metric, based on its User Interface name.
from google.analytics.data_v1beta import BetaAnalyticsDataClient
from google.analytics.data_v1beta.types import GetMetadataRequest
from google.analytics.data_v1beta.types import MetricType

def sample_run_report(property_id):
    """Runs a metadata report on a Google Analytics 4 property."""

    # Using a default constructor instructs the client to use the credentials
    # specified in GOOGLE_APPLICATION_CREDENTIALS environment variable.
    client = BetaAnalyticsDataClient()

    request = GetMetadataRequest(name=f"properties/{property_id}/metadata")
    response = client.get_metadata(request)

    output =[]
    for dimension in response.dimensions:
        output.append({"Type": "Dimension", "API_Name": f"{dimension.api_name}", "UI_Name": f"{dimension.ui_name}", "Description": f"{dimension.description}", "Custom_definition": f"{dimension.custom_definition}", "Metric_type": "N/A"})

    for metric in response.metrics:
      output.append({"Type": "Metric", "API_Name": f"{metric.api_name}", "UI_Name": f"{metric.ui_name}", "Description": f"{metric.description}", "Custom_definition": f"{metric.custom_definition}", "Metric_type": f"{MetricType(metric.type_).name}"})

    df = pd.DataFrame(output)
    df.to_csv("export.csv")

sample_run_report(PROPERTY_ID)
df = pd.read_csv("export.csv")
df.head(5)
I hope you enjoyed learning about using the new Google Analytics Data API (GA4) with Python. You can find more code snippets in Google’s Github Repo
If you have any questions, please do not hesitate to contact me on LinkedIn. Or send a message in the comments below.
Pingback: Google Analytics 4 (GA4) - Tutorial [Extended Guide] - Automation Help
hay, I would like to ask about batch run requests, there may be different metrics and dimensions between requests
RunReportRequest(
dimensions=[Dimension(name=”city”)],
metrics=[Metric(name=”activeUsers”)],
date_ranges=[DateRange(start_date=”5daysAgo”, end_date=”today”)]
), RunReportRequest(
dimensions=[Dimension(name=”country”)],
metrics=[Metric(name=”totalUsers”)],
date_ranges=[DateRange(start_date=”5daysAgo”, end_date=”today”)]
it’s possible to have different metric and dimension ?
I think that should be possible indeed. You would need to change a bit the way you parse the output. But I guess the response object contains the domain and metric name as one of its keys as well.
can you please let me know what to fill in the service_account_file_path place
os.environ[‘GOOGLE_APPLICATION_CREDENTIALS’] = service_account_file_path
You need to follow the steps from the chapter “Authentication”. Then you will get a JSON file. service_account_file_path should then be the path to that file
This is one of the best technical article I have gone through in a while, very detailed to the point cohesive and complete, thanks a lot for taking time in writing this.
Only one question though, is there are way to pull segment data in GA-4 like we used to pull in previous version.
Thanks
Thanks for the compliment! Not sure if I understand your question completely. But if you mean we can pull the data using the previous API, then the answer is no. If you mean if we can use the exact same functions we used for the previous API, then the answer is unfortunately no as well. GA4 has a different API and a different data structure, so you will need to pull data differently.
When I run the simple report, it works great, but when I run the real time report, I get an empty dataframe. Is there any possible reason for this?
Have you tried visiting your website within 30 minutes before running that report?