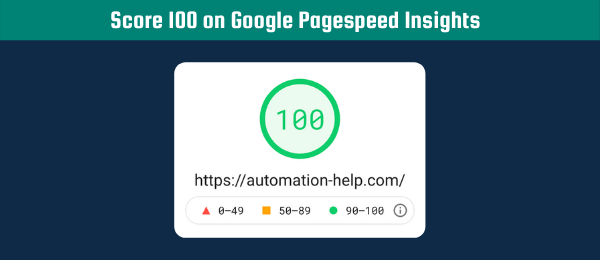
When I created my first WordPress website, my first goal included a high score on the Google PageSpeed Insight test. I knew that a website’s page speed is an important factor in Google’s ranking, which is also confirmed by Google. No one likes to wait, so it definitely improves your User Experience. A 100 score is not a must, but you want to address the biggest page speed issues as found in the recommendations by the Google PageSpeed Insights Test. Therefore, I will explain what the Google PageSpeed Insights Test is, and how you can use it to improve your website.

- Introduction to the Google PageSpeed Insights Test
- Increase your score for the Google PageSpeed Insights Test

Introduction to the Google PageSpeed Insights Test
If you only want to know how to improve your page speed, then scroll to the bottom for more information. For the people unfamiliar with Google PageSpeed Insights Test, I will explain what it is. This tool was developed by Google and allows you to get an overall page speed score and other sub-scores. These scores are based on Lighthouse an open-source, automated tool for improving the quality of web pages. The easiest way to get a page speed score is by going to https://developers.google.com/speed/pagespeed/insights/. Google makes use of two types of data:
- Lab Data
- Field Data
Lab Data
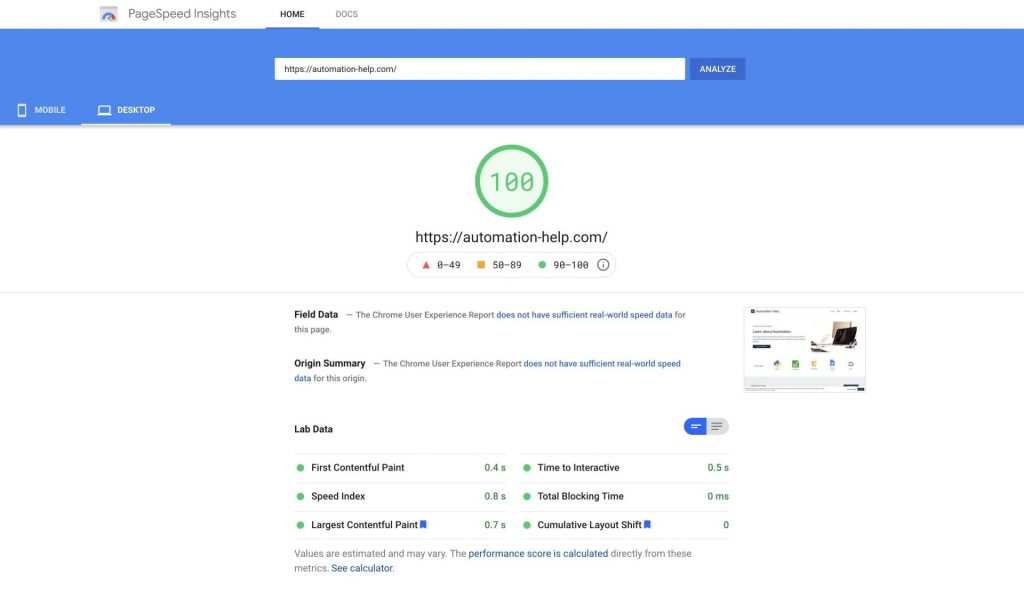
Lab data, as the name suggests is comparable to how scientists collect data in a laboratory. It happens in a controlled environment where Google is able to control factors such as the device and network settings. As with any experiment in a laboratory, the goal is to create an environment that you are able to replicate with each test, hence creating reproducible results. This allows Google to precisely pinpoint performance issues. However, you can imagine that this is not always a perfect representation of the real-world situation. In Lighthouse 6, Google looks at the following lab data metrics:
- Speed Index
- Time to Interactive
- Total Blocking Time.
- First Contentful Paint (FCP)
- Largest Contentful Paint (LCP)
- Cumulative Layout Shift (CLS)
Speed Index
Speed index is about load speed and measures how quickly elements are visually displayed. Lighthouse actually makes a small video of your page being loaded and looks at individual frames using a JavaScript module (Speedline Node.js). It then compares your page speed index with those of real websites (using HTTP archive). This score is an overall score of your speed, and so anything you do to improve any other factors will also improve your speed Index. For more info about Speed Index, check Google’s documentation.
Time to Interactive
Time To Interactive is an overall measure of your website interactivity. As you will later read in this article, many metrics focus on perceived load speed. This means that some people will optimize for these metrics while not taking into account the main purpose of these metrics, user experience. If you have a fast-loading website but it is not interactive then you will still have a bad user experience.
Therefore, Google uses the time to interactive to measure when the page is fully interactive. This is defined as the page displaying useful content (based on First Contentful Paint), event handlers are registered for the most visible page element, and the page is able to respond to user interactions within 50 milliseconds. This means that you want the content to be displayed as soon as possible, but also to make sure people are able to interact as soon as possible. For more info about Time To Interactive, check Google’s documentation.
Total Blocking Time
Total Blocking Time (TBT) combines First Contentful Paint (FCP), and Time To Interactive (TTI) and measures the differences in time between those two moments. In other words, as long as the page has visible content and a user is not able to interact with the website your total blocking time will keep counting. You can improve this metric in the same way as you would improve First Input Delay (FDI). For more info about Total Blocking Time, check Google’s documentation.
I will explain First Contentful Paint (FCP), Largest Contentful Paint (LCP), Cumulative Layout Shift (CLS) in the section below.
Field Data
Field data represents this real-world situation in a better manner. It is based on the Chrome User Experience Report, which is a measurement of user experience metrics by actual users. With certain settings in Google Chrome, a user is able to opt-in and help Google collect this field data. All of this field data focuses on load performance. However, Google has mentioned that they want to look at other factors that affect user experience. For now, it looks at the following metrics:
- First Contentful Paint (FCP)
- First Input Delay (FID)
- Largest Contentful Paint (LCP)
- Cumulative Layout Shift (CLS)
| Good | Needs Improvement | Poor | |
|---|---|---|---|
| FCP | [0, 1000ms] | (1000ms, 3000ms] | over 3000ms |
| FID | [0, 100ms] | (100ms, 300ms] | over 300ms |
| LCP | [0, 2500ms] | (2500ms, 4000ms] | over 4000ms |
| CLS | [0, 0.1] | (0.1, 0.25] | over 0.25 |
First Contentful Paint (FCP)
First Contentful Paint (FCP) is all about perceived load speed and measures the time between the start of a page load until the moment a user sees something on this page. “Seeing something” could be something as simple as text or image, but also things like a SVG element or a non-white canvas element. This means that you would want your website to start loading a visible element as soon as possible, hence do not load everything at the same time. For more info about FCP, check Google’s documentation.
First Input Delay (FID)
First Input Delay (FID) focuses on load responsiveness and measures the time between user interaction and the moment the browser is able to respond to this interaction. User interaction can be anything from clicking a link to tapping a button or clicking on an input field. Ways to optimize this metric is reducing the impact of third-party code, reduce JavaScript execution time, and keep request counts low and transfer sizes small. For more info about FID, check Google’s Documentation.
Largest Contentful Paint (LCP)
Largest Contentful Paint (LCP) is comparable to First Contentful Paint (FCP) as it also focuses on perceived load speed. However, LCP measures the time between the start of a page load until the main content has (likely) loaded). Google assumes the main content has likely loaded if the largest element was rendered. You can improve this score by making sure you are not using render-blocking JavaScript and CSS and reduce client-side rendering. But something even more important is making sure you have chosen a fast hosting company. I am using Versio (Max package), which allows me to reach a Largest Contentful Paint of 2.3 seconds and a PageSpeed score of 96 on Mobile (click for more info, sponsored). For more info about LCP, check Google’s Documentation.
Cumulative Layout Shift (CLS)
Cumulative Layout Shift (CLS) focuses on visual stability and measures an aggregated layout shift score for each individual occurrence. A layout shift is an unexpected movement of an element on the page, in other words when a visible element moves from one moment to the other. You want to make sure that if you are loading elements asynchronously that you make sure the dimensions are known before they are loaded. That way they can already take up the space that they will eventually take up. Also, if you are adding elements dynamically to your page, make sure you do this as soon as possible and not when your page has almost finished loading. For more info about CLS, check Google’s Documentation.
Increase your score for the Google PageSpeed Insights Test
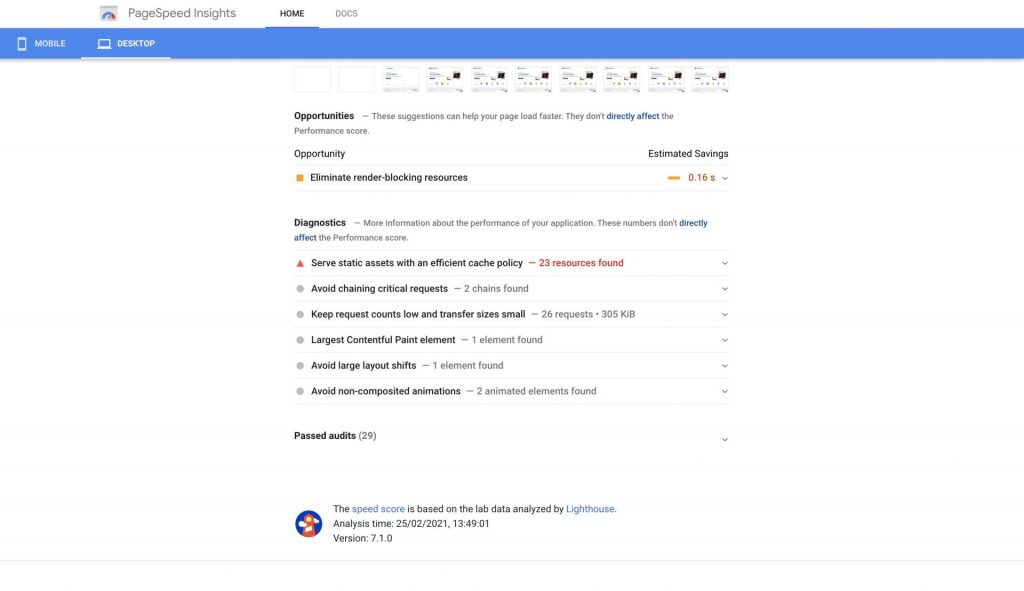
Google will provide you recommendations, which are relatively straightforward. If you implement these recommendations, your Google’s PageSpeed Insights score will increase. As I am running my website using WordPress, I will give you some extra tips to increase your Google’s PageSpeed Insights score. Some of these tips will apply to non-WordPress websites as well but might involve a more difficult implementation.
- Reduce the number of plugins
- Optimize Images
- Optimize JavaScript and CSS
- Use a lightweight theme
- Choose a fast hosting company

Reduce the number of plugins
If you are starting with WordPress you might be amazed by the numbers of plugins. There is literally a plugin for everything, and that is amazing if you are trying to save time. Or maybe you do not know any code, or you do not know anything about WordPress at all. Really convenient, but horrible for your page speed. Depending on the complexity of the plugin, it will negatively affect your page speed. Each time your website loads, all the underlying plugins are loaded as well. Therefore, you want to minimize the number of plugins that you are using. The five plugins I am using revolve around four main topics:
- Security (e.g. WordFence)
- Speed Optimizers (EWWW image optimize & Autoptimize)
- SEO (Yoast)
- Privacy (GDPR Cookie Consent)
For non-WordPress websites I would say you want to reduce the number of packages on your server. Additionally, do not try to load a JavaScript library for every small task on your website.
Optimize images
Optimizing your images does not only mean resizing the dimensions but also using the right formats. Only use the dimensions for an image that is relevant, which means that you do not need a 1000px by 1000px website for a mobile phone. Ideally, you will show different sizes of images for different screen sizes. When I mentioned the word format, I am talking about JPG, PNG, WebP etc. Honestly, I do not know that much about the exact differences between those formats. However, what you should know is that the format influences the image size. WebP is a modern format that are about 25% smaller in size than PNGs, and about 25-35% smaller than JPEGs. Moreover, you can optimize images by using lazy-loading. This allows you to display a placeholder image with a smaller size than the actual image. Your page will load faster using this lazy-loading approach.
In summary, you can optimize images using the following approaches
- Reduce the dimensions
- Use modern formats (preferably WebP)
- Use lazy-loading
Ewww Image Optimizer plugin allows you to implement all of the aforementioned recommendations. Click on the sponsored banner below to learn more.
Optimize JavaScript and CSS
An important part of optimizing your JavaScript and CSS involves minimizing your code. Whenever you are writing code, you are adding spaces and newlines (enters) to make it more readable and understandable (for humans). However, computers “do not care” about this kind of readability, for them it is actually counterproductive. A computer will need to read all these unnecessary white spaces, which influences the time it takes to read the whole script. Minimizing your code involves getting rid of all these white spaces and increases the speed by which the browser is able to read all of this code.
Additionally, you can use an asynchronous approach for loading your JavaScript. Any JavaScript that is not essential for the content of your website, should be loaded asynchronously. This means you are loading this code in parallel with the loading of other code. In contrast, loading code synchronously means that you wait for one piece of code to finish loading before you lead the following.
Autoptimize plugin allows you to minimize the code on your website, aggregate this code, but also lazy load images and has other many other optimization features.
Use a lightweight theme
There are many different beautiful themes with endless configuration options. However, if you want a high page speed score, you need to choose a lightweight theme. Personally, I am using WP Astra, which has many nice starters templates to speed up your website creation. WP Astra is created by taking into account the impact it has on your website’s speed. Therefore, this lightweight theme does not use JQuery, is less than 50kb, and loads within 0.5 seconds. Additionally, the paid option allows you to integrate WooCommerce and add more layout options (click on the sponsored banner below for more info).
Choose a fast hosting company
I can not stress this enough, but you can be doing everything perfectly and still have a low score on the Google PageSpeed Insights Test. This has happened to me actually, where I optimized everything but I was running my website on the cheapest hosting plan. At that moment I had a page speed score of around 80. After upgrading my package I was able to get a score of 96 (mobile) and 100 (desktop). Currently, I am running my website on the Max Package on Versio.eu. You can click on the sponsored banner below to find the most relevant package for you. They also offer domains, VPS servers, and SSL certificates.
I hope you have a better understanding of the Google PageSpeed Insights Test, how it measures a score for your page speed, and how you can increase that score. If you have any questions, do not hesitate to leave a comment below.


